Graphs in BetTrader
In order to see the graphs in the left panel when you load a market, you need to have graphs selected in the Settings menu. Go into Settings and scroll down to Graphs then make sure that Show Panel and Panel Open are ticked. If they are not, tick them then click on the purple save icon to save your settings before leaving the Settings menu.
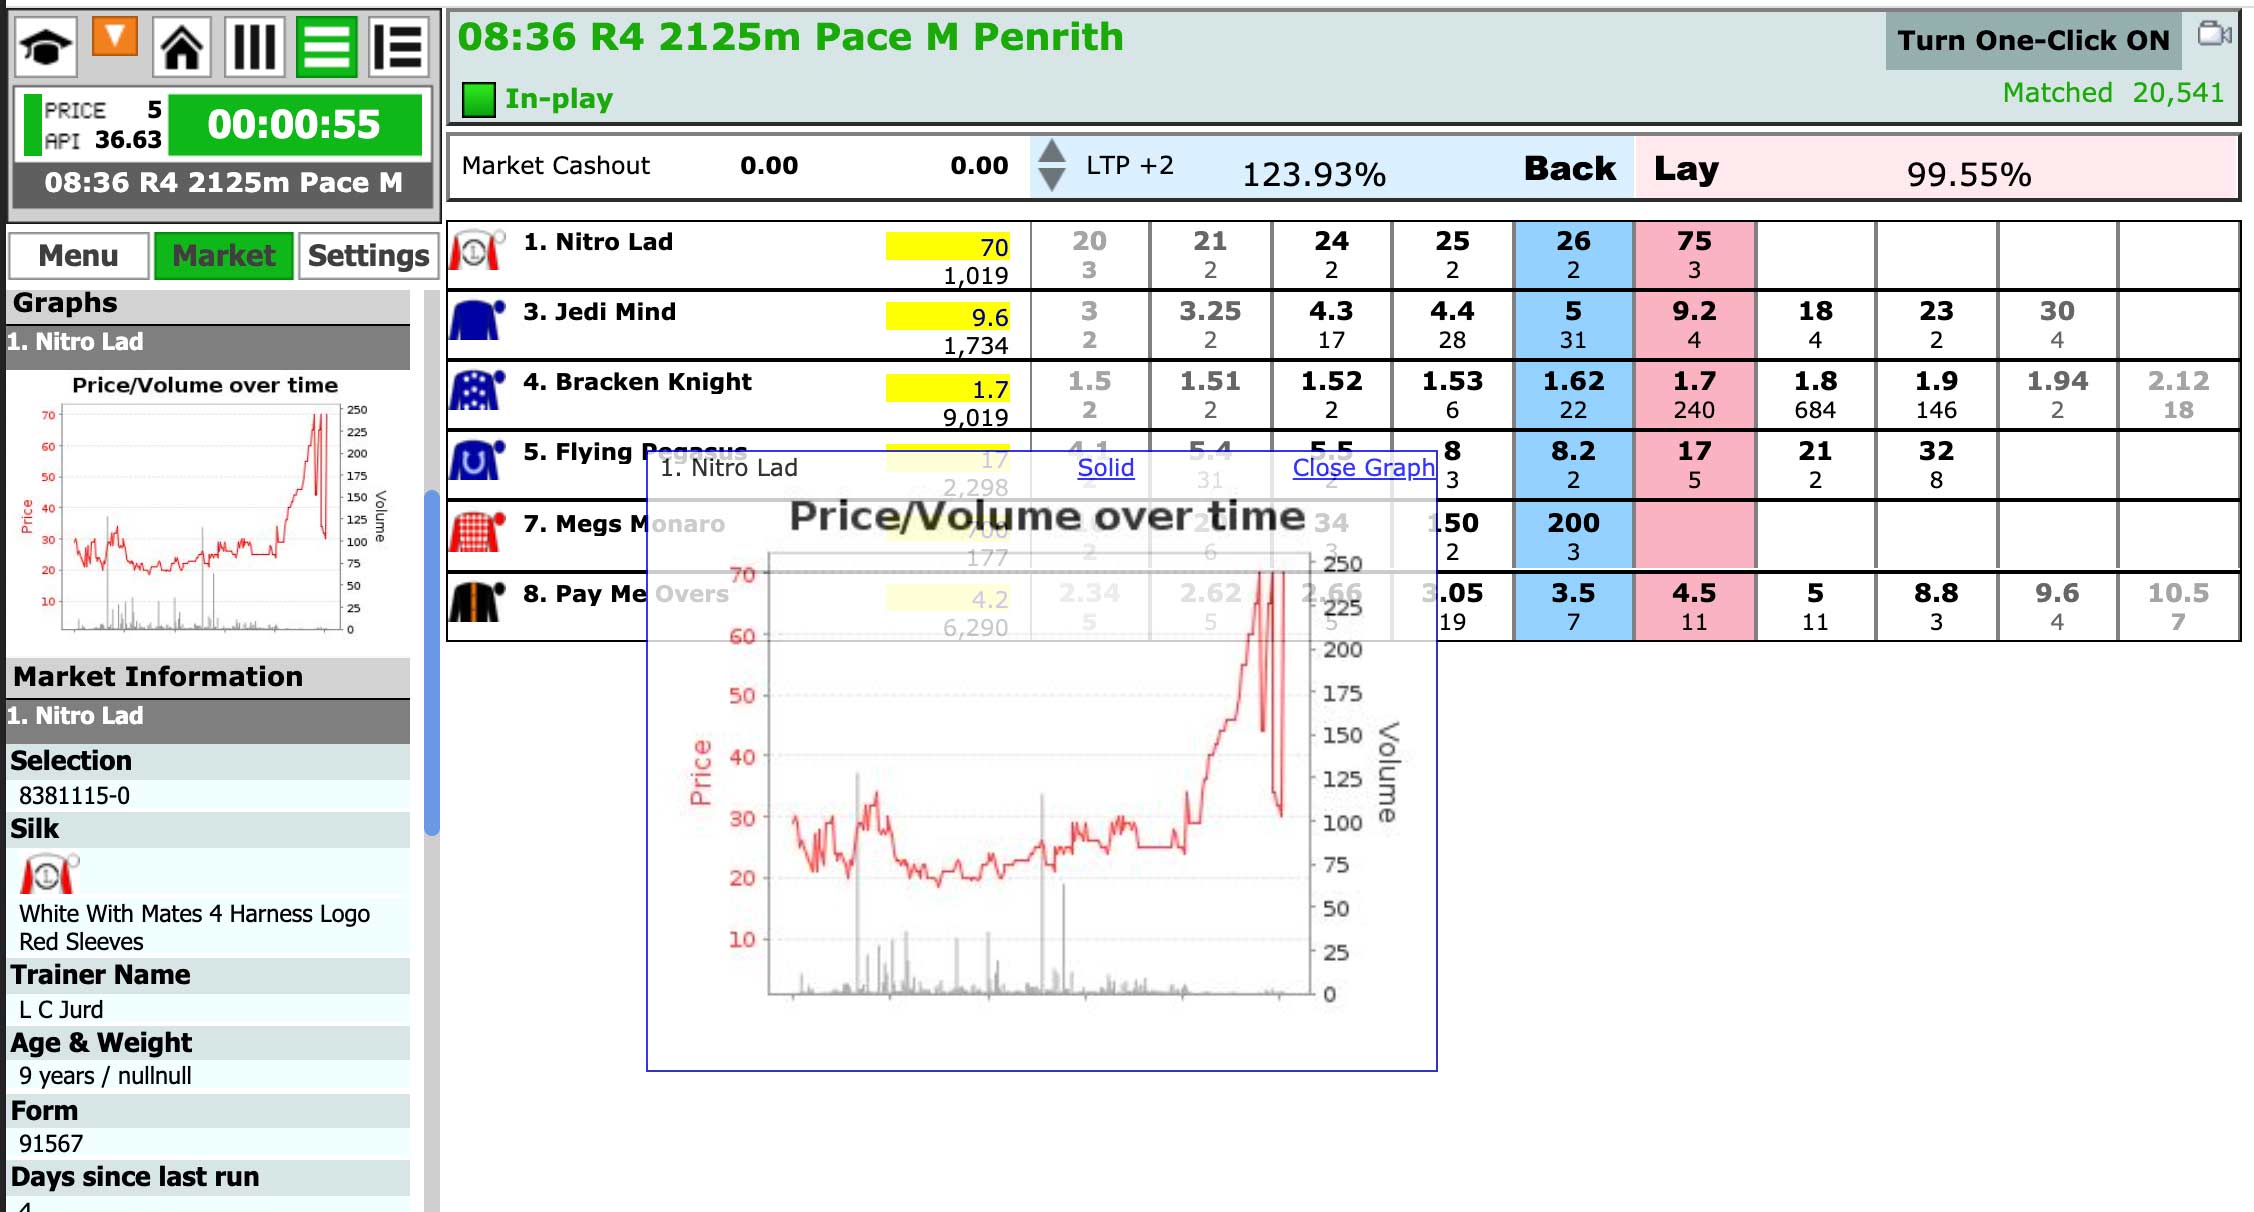
You can see the Betfair graph for one selection at a time in the graphs panel on the left. To load a graph click on the jockey silks or sports icon of your chosen selection either in grid or ladder mode. Clicking on the silks for another runner will change the graph to the one for that runner.
You can make the graph bigger by clicking on it. A larger version will open up and you can drag and drop this into a suitable position on your screen. There is an option to make this larger graph transparent so that you can continue to see the market movement behind the floating graph.
You can close the larger graph by clicking in the top right corner.